RESEARCH

Implicit Uncertainty and Representative Direct Ensemble Visualizations

Currently, the most widely used approaches for visualizing ensembles are spaghetti plots and summary displays, both of which are usually integrated into ensemble visualization applications as they are complementary to each other: while spaghetti plots have the advantages of visually depicting as much information as possible, they potentially include visual clutter; on the other hand, while summary displays avoid the visual clutter, they do not represent the complete information of the ensembles, resulting in the difficulty of exploring and comparing the data. This ongoing project focuses on developing direct ensemble visualization which appears as a hybrid of these two techniques, meaning that the explicitly portrayed representative collection of actual ensemble members are summarized based on the significant statistical features of the complete ensemble, thus keeping the advantages and minimizing the limitations of these two techniques.

Visualizing Uncertain Tropical Cyclone Predictions using Representative Samples from Ensembles of Forecast Tracks

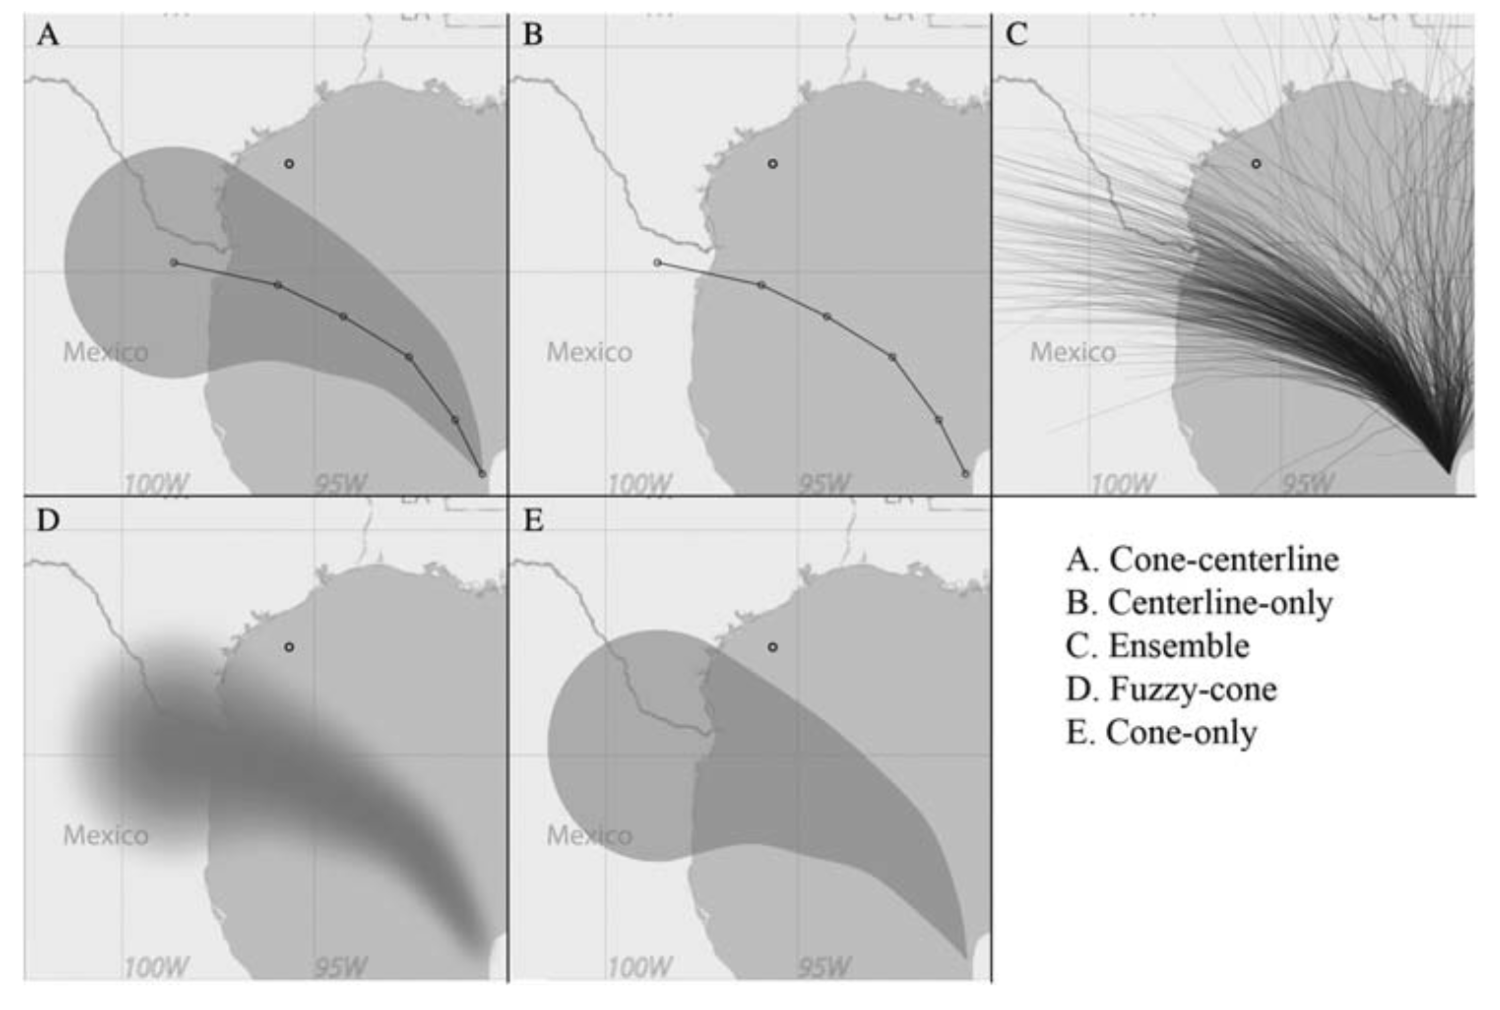
A common approach to sampling the space of a prediction is the generation of an ensemble of potential outcomes, where the ensemble’s distribution reveals the statistical structure of the prediction space. For example, the US National Hurricane Center generates multiple day predictions for a storm’s path, size, and wind speed, and then uses a Monte Carlo approach to sample this prediction into a large ensemble of potential storm outcomes. Various forms of summary visualizations are generated from such an ensemble, often using spatial spread to indicate its statistical characteristics. However, studies have shown that changes in the size of such summary glyphs, representing changes in the uncertainty of the prediction, are frequently confounded with other attributes of the phenomenon, such as its size or strength. In addition, simulation ensembles typically encode multivariate information, which can be difficult or confusing to include in a summary display. This problem can be overcome by directly displaying the ensemble as a set of annotated trajectories, however this solution will not be effective if ensembles are densely overdrawn or structurally disorganized. We propose to overcome these difficulties by selectively sampling the original ensemble, constructing a smaller representative and spatially well organized ensemble. This can be drawn directly as a set of paths that implicitly reveals the underlying spatial uncertainty distribution of the prediction. Since this approach does not use a visual channel to encode uncertainty, additional information can more easily be encoded in the display without leading to visual confusion. To demonstrate our argument, we describe the development of a visualization for ensembles of tropical cyclone forecast tracks, explaining how their spatial and temporal predictions, as well as other crucial storm characteristics such as size and intensity, can be clearly revealed. We verify the effectiveness of this visualization approach through a cognitive study exploring how storm damage estimates are affected by the density of tracks drawn, and by the presence or absence of annotating information on storm size and intensity.

Uncertainty Visualization by Representative Sampling from Prediction Ensembles

Data ensembles are often used to infer statistics to be used for a summary display of an uncertain prediction. In a spatial context, these summary displays have the drawback that when uncertainty is encoded via a spatial spread, display glyph area increases in size with prediction uncertainty. This increase can be easily confounded with an increase in the size, strength or other attribute of the phenomenon being presented. We argue that by directly displaying a carefully chosen subset of a prediction ensemble, so that uncertainty is conveyed implicitly, such misinterpretations can be avoided. Since such a display does not require uncertainty annotation, an information channel remains available for encoding additional information about the prediction. We demonstrate these points in the context of hurricane prediction visualizations, showing how we avoid occlusion of selected ensemble elements while preserving the spatial statistics of the original ensemble, and how an explicit encoding of uncertainty can also be constructed from such a selection. We conclude with the results of a cognitive experiment demonstrating that the approach can be used to construct storm prediction displays that significantly reduce the confounding of uncertainty with storm size, and thus improve viewers’ ability to estimate potential for storm damage.

Visualizing Time-Specific Hurricane Predictions, with Uncertainty, from Storm Path Ensembles

The U.S. National Hurricane Center (NHC) issues advisories every six hours during the life of a hurricane. These advisories describe the current state of the storm, and its predicted path, size, and wind speed over the next five days. However, from these data alone, the question “What is the likelihood that the storm will hit Houston with hurricane strength winds between 12:00 and 14:00 on Saturday?” cannot be directly answered. To address this issue, the NHC has recently begun making an ensemble of potential storm paths available as part of each storm advisory. Since each path is parameterized by time, predicted values such as wind speed associated with the path can be inferred for a specific time period by analyzing the statistics of the ensemble. This paper proposes an approach for generating smooth scalar fields from such a predicted storm path ensemble, allowing the user to examine the predicted state of the storm at any chosen time. As a demonstration task, we show how our approach can be used to support a visualization tool, allowing the user to display predicted storm position – including its uncertainty – at any time in the forecast. In our approach, we estimate the likelihood of hurricane risk for a fixed time at any geospatial location by interpolating simplicial depth values in the path ensemble. Adaptively- sized radial basis functions are used to carry out the interpolation. Finally, geometric fitting is used to produce a simple graphical visualization of this likelihood. We also employ a non-linear filter, in time, to assure frame-to- frame coherency in the visualization as the prediction time is advanced. We explain the underlying algorithm and definitions, and give a number of examples of how our algorithm performs for several different storm predictions, and for two different sources of predicted path ensembles.

Non-expert interpretations of hurricane forecast uncertainty visualizations

Uncertainty represented in visualizations is often ignored or misunderstood by the non-expert user. The National Hurricane Center displays hurricane forecasts using a track forecast cone, depicting the expected track of the storm and the uncertainty in the forecast. Our goal was to test whether different graphical displays of a hurricane forecast containing uncertainty would influence a decision about storm characteristics. Participants viewed one of five different visualization types. Three varied the currently used forecast cone, one presented a track with no uncertainty, and one presented an ensemble of multiple possible hurricane tracks. Results show that individuals make different decisions using uncertainty visualizations with different visual properties, demonstrating that basic visual properties must be considered in visualization design and communication.

Remote 3D Human Body Shape Modeling and Measuring

Realistic 3D human body model acquisitions are anxiously needed by a wide range of fields including clothing industry, medicine, health care, sports and fitness, to name but a few. However, currently existing solutions usually require to use sophisticated and expensive scanning devices or complicated modeling software. This project combines AI, computer vision, and computer graphics to develop techniques which compute precise 3D human body shape models from just two photos of a standing person.

Identifying Target Features In A Layered Stereoscopic Display

Computer visualizations of 3D medical or geological data often require the simultaneous display of multiple layers. These displays tend to be difficult to interpret visually. This research seeks to improve understanding of the role that texture, applied to two surfaces, plays in helping to locate target features in such displays. A 3D eye-tracking system is employed to examining subjects' eye movements when displaying the visualiztion.